Observability and Monitoring
12月 11, 2022 tech postThere is a well-known post to explain the vocabulary Observability: Metrics, tracing and logging. It defines what kind of data we need for the observability.
But I felt that we messed it up with another word Monitoring sometimes. As explained in Peter’s article, the observability includes metrics, tracing and logging, which saying the aggregatable data, capacity to identify the request scoped data and the discrete events.
Based on that I think the Monitoring should be made up of two parts:
- A subset of the data in Observability( metrics data, tracing data, logging events data)
- The actions for each data from the subset above
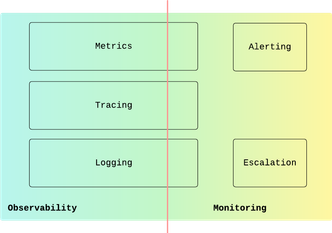
The second one, the action, it includes Alerting and Escalation. The alerting means the capability to know someting is getting wrong, either to trigger a Slack message or a webhook trigger. The escalation means the capability to find the right people/system to handle that alert. it may follow up some schedules and call/send message to the team.
It may not a perfect definition but looks work for me ATM.